Loading categories...
The African Critical Mineral Engine
Geologic arbitrage, commercial flows & geopolitical choke points — interactive research infographics (A++ 2026 Edition)
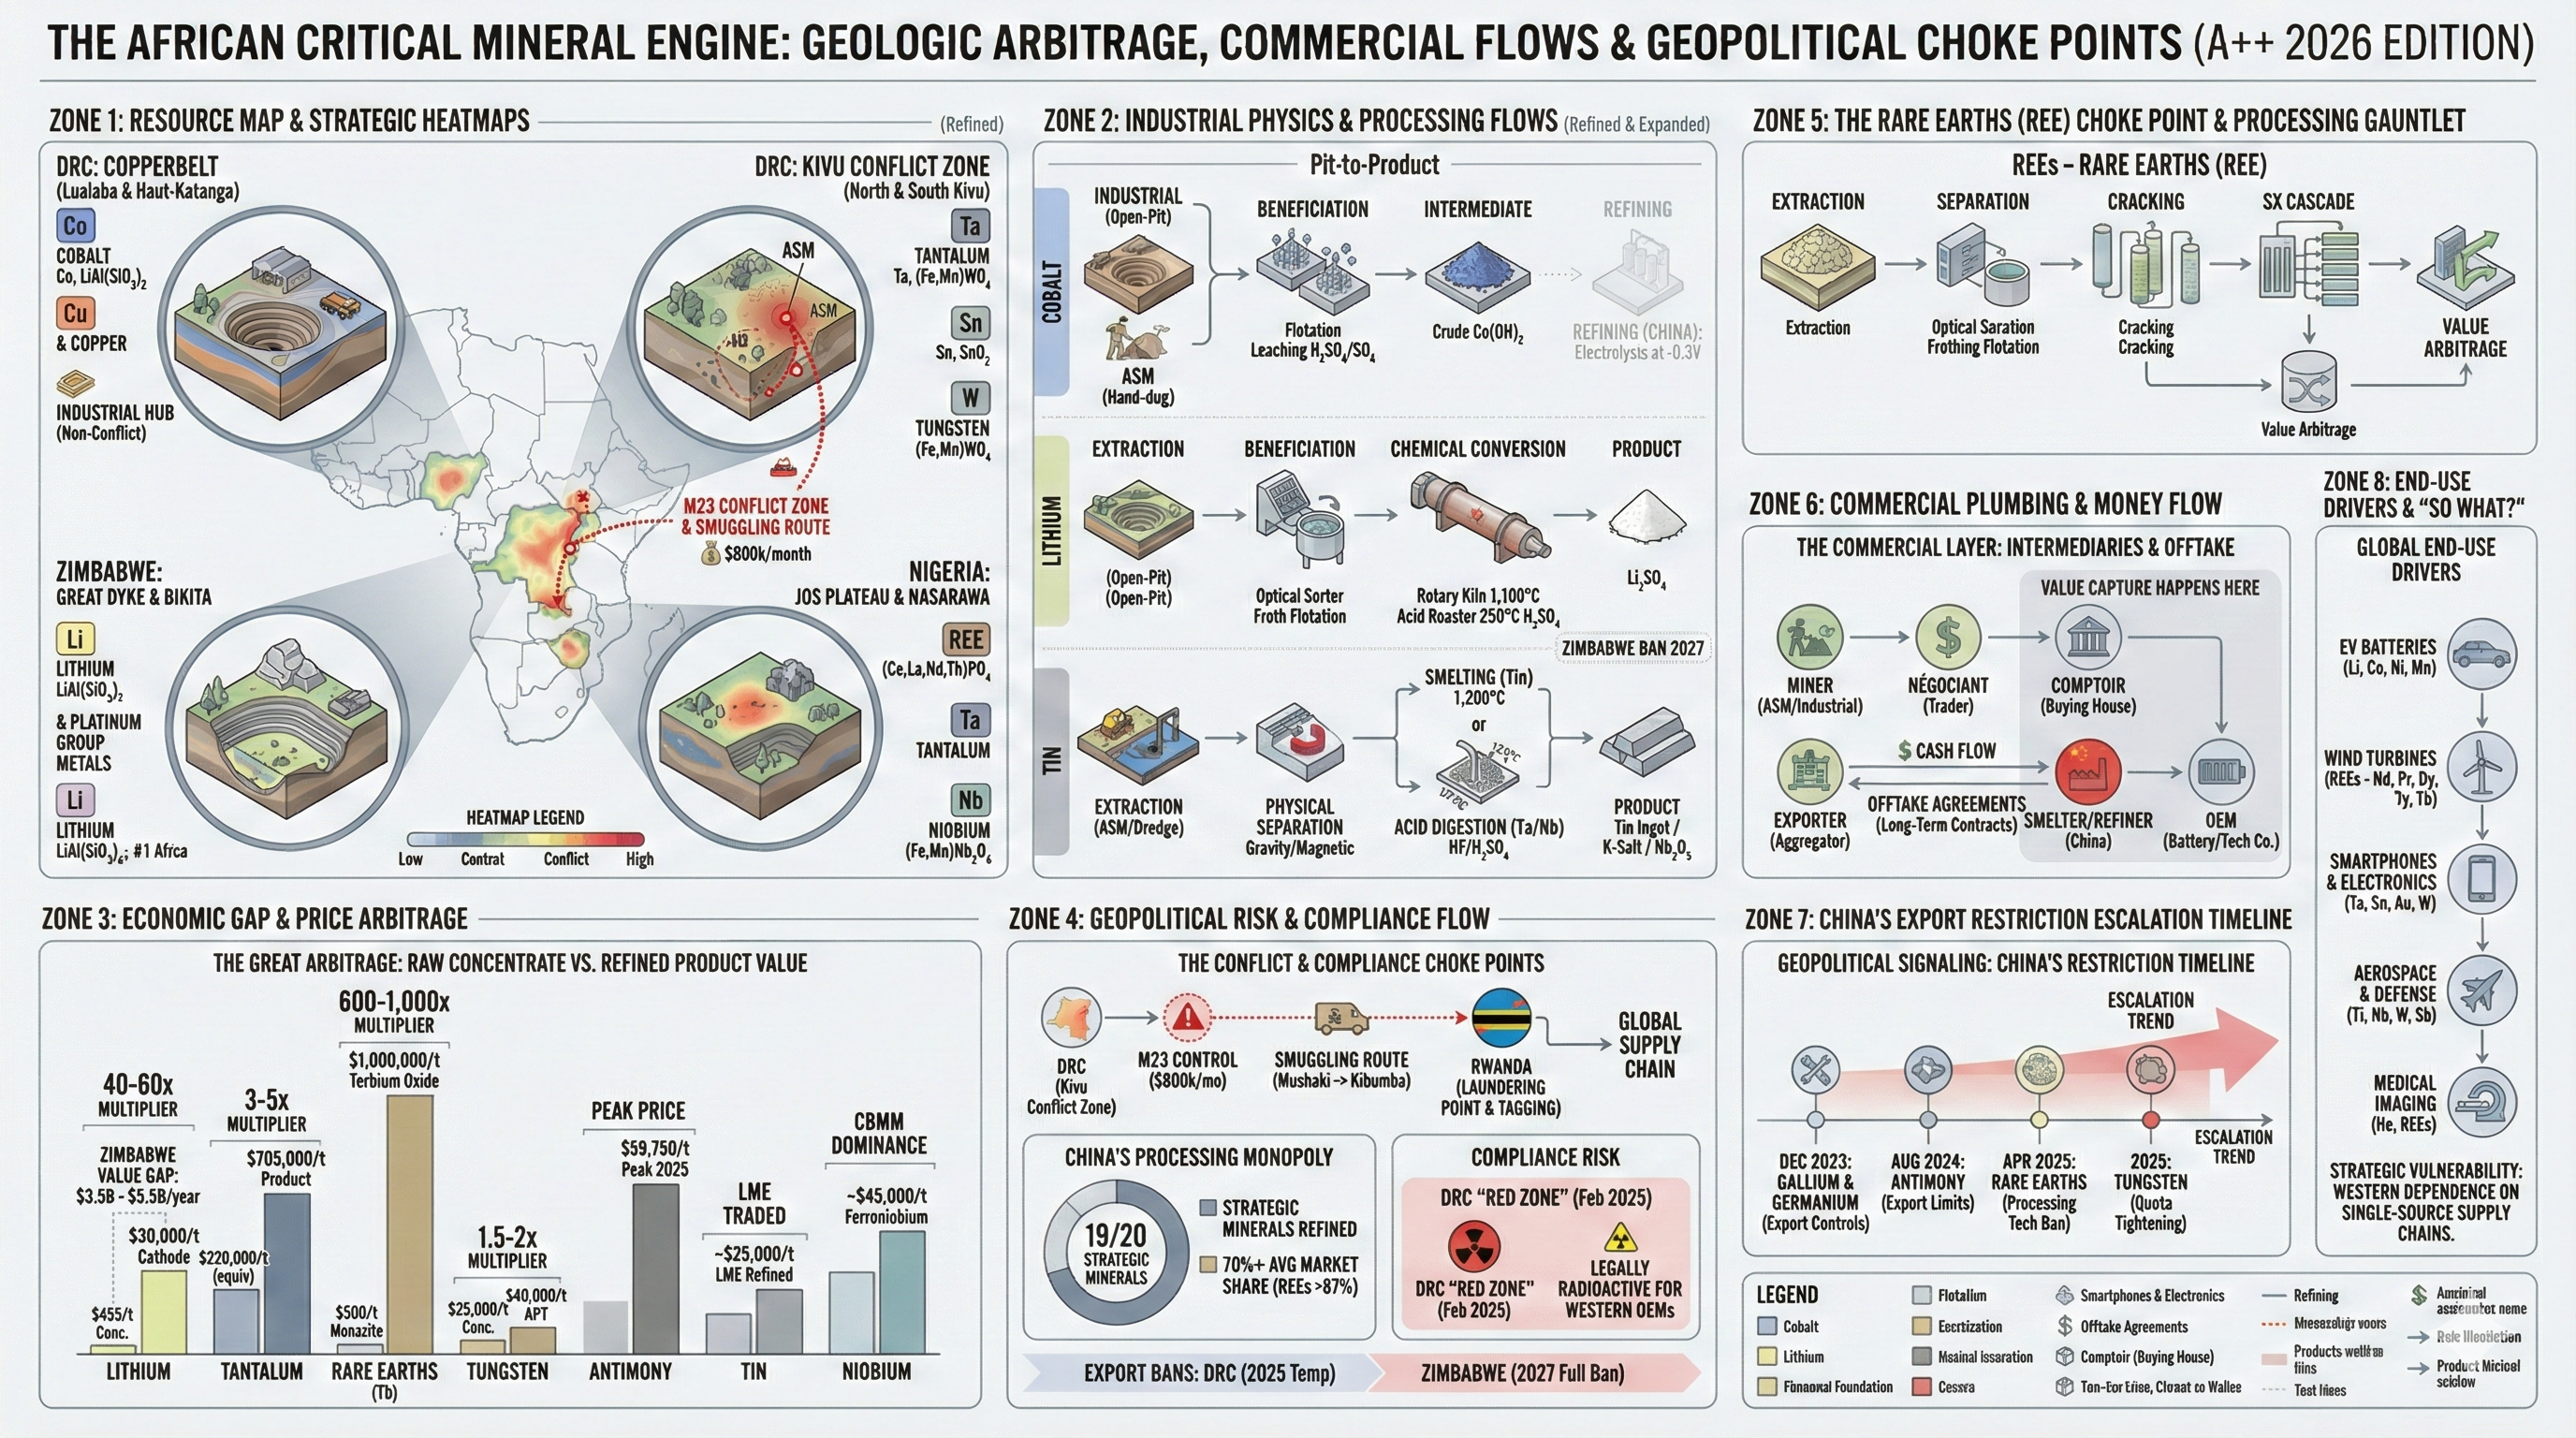
Resource Map & Strategic Heatmaps
Key producing nations, mineral deposits, conflict zones, and resource concentration by country.
Strategic Mineral Heat Map
Production share + reserves intensity by mineral and country. Higher = more concentrated supply risk.
Industrial Processing Flows
Pit-to-product value chains showing exactly how raw African minerals become refined components. Value capture is overwhelmingly outside Africa.
The Great Arbitrage
Raw concentrate vs refined product value. Africa captures the low end; China & the West capture the multiplied value.
Note: multipliers compare raw product to refined product on a per-tonne basis; for contained-metal equivalents, adjust for grade and payability. Data as of Q4 2024 / early 2025 unless otherwise noted.
Geopolitical Risk & Compliance
Conflict zones, smuggling routes, export bans, and compliance choke points across African mineral supply chains.
China's Processing Monopoly
19 of 20 strategic minerals processed in China. Escalating export controls weaponize supply chains.
Export Restriction Escalation Timeline
Each wave targets minerals where China has dominant processing capacity — even when raw materials originate elsewhere.
End-Use Drivers — “So What?”
Global demand sectors consuming critical minerals. Each sector creates structural demand growth independent of commodity cycles.
Market Data — Live Prices
Real-time prices for critical & strategic mineral equities and ETFs. Click any row to expand daily/weekly/monthly charts.
| Ticker | Name | Last | 1D % | Trend |
|---|